


Differentiation situation! Global container trade shows strong resilience
Multiple data confirm that Global container trade shows strong resilience, import demand from Latin America, Europe and Africa is strong; however, regional differences are significant, demand for North American routes is weak, andCargo volumes on intra-Asia and Middle East trade routes are more stable.
Demand trends show differentiation
Maersk stated in the "Asia Pacific Third Quarter Market Information" that with theAs 2025 enters the last quarter, supply chains in the Asia-Pacific region continue to evolve amid continued macroeconomic uncertainty and dynamic adjustments to trade policies.
Inside MaerskSeptember data shows thatGlobal container trade showed strong resilience from May to July, year-on-year growth4.9%. Import demand from Latin America, Europe and Africa is strong, and exports from western Central Asia and the Far East have also maintained steady growth.
However, regional differences remain significant: North American imports were flat year-on-year and still significantly lower thanAverage from 2011-2019. Imports from Far East Asia also declined, falling 4.2% between May and July. SeaIntelligence (Issue 732) confirms this divergent trend, noting that demand is weak in the US direction, whileCargo flows on intra-Asia and Middle East trade routes are more stable.
Global container trade performance exceeded expectations, showing strong resilience
The latest data from Container Trade Statistics (CTS) shows that global container trade volume continues to break expectations of a slowdown in August. After exceeding 16 million TEU for three consecutive months, it reached 16.61 million TEU in August, slightly exceeding the historical record of 16.59 million TEU set in May this year, showing that the actual performance of today's shipping market is stronger than expected.
CTS said, “August continued this trend of strong performance, reaching 16.61 million TEU, which is now the highest monthly freight volume ever in the CTS database, surpassing May 2025’s 16.59 million TEU.”
CTS noted that “While the month-on-month growth was modest at 0.2%, it highlights the continued strength of global container trade volumes in 2025.”
CTS data shows that global container trade volume has exceeded 126.75 million TEU in the first eight months, an increase of 4.4% compared with the same period in 2024.
CTS noted, “It is clear that the market has exceeded expectations this year. Monthly data have reached record highs for several consecutive months and resilient trade patterns highlight the strength and adaptability of the global container shipping market.”
CTS emphasized that "actual performance in 2025 far exceeded initial forecasts, highlighting the market's ability to maintain growth while coping with challenges."
However, weak freight rates will continue to worry operators,The CTS global freight index fell for the second consecutive month. Even more worrying is the long-term trend - its freight rate index has been declining since December 2002, with only a brief one-month rebound in May.
CTS noted that "the global freight index fell 3 points to 81 points in August, continuing a steady decline since June 2025."
"This compares to 115 points for the same period last year, indicating that despite strong volume performance, the market continues to adjust."
North American routes perform poorly
The poor performance of North American routes in August was in sharp contrast to the strong global container trade.
According to the latestAccording to CTS data, only imports from Oceania and sub-Saharan Africa have increased, while imports from the Far East's trans-Pacific trunk line have fallen by 12.3% year-on-year, a decrease of approximately 300,000 TEU compared with August 2024, which shows the impact of US tariff policy on this year's "peak season".
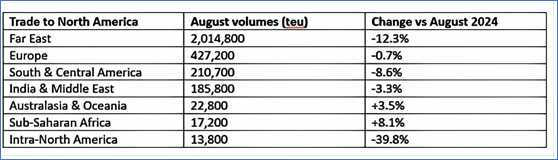
Of particular concern is thatThe CTS data counts cargo loaded in August, not the number of containers unloaded at the destination port.
Differentiation situation, Far East-Other routes showed double-digit growth
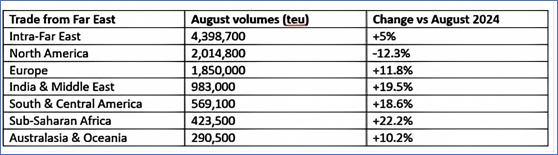
At the same time, the ability of other markets to absorb continued high export volumes from the Far East hasThere were no signs of abating in August, with all routes except North America showing double-digit growth.
USAContainer import volume fell by 8.4% month-on-month in September
Shipping industry news,Descartes data shows that in September 2025, U.S. container imports fell 8.4% month-on-month to approximately 2.308 million TEU. This further confirms that container import volumes at major US ports will steadily decline before the end of the year due to the uncertainty of Trump's 2.0 tariff policy.
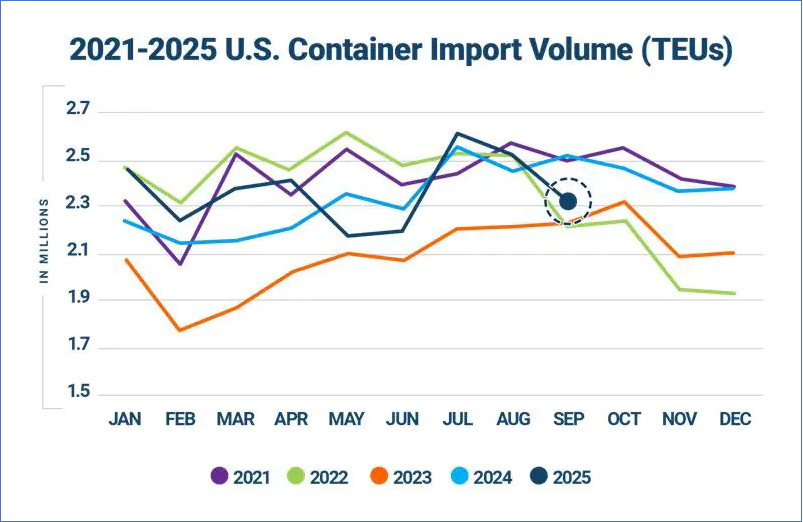
In September 2025, U.S. imports from China fell by 12.3% month-on-month and 22.9% year-on-year to 762,000 TEU. Compared with the historical peak of 1.023 million TEU set in July 2024, it dropped by 25.4%. In September, China's share of U.S. container imports fell to 33.0% from 34.5% in August.
At the port level,In September, the container import volume of the top 10 ports in the United States fell by 7.9% month-on-month or 169,455TEU. Declines were seen at most major ports, with larger declines at the Port of Long Beach (-11.4%), Baltimore (-12.6%) and Savannah (-9.1%). Cargo volumes also declined at the Port of Los Angeles (-7.6%), New York/New Jersey (-8.6%), Charleston (-7.6%), Norfolk (-6.2%) and Oakland (-6.4%). The Port of Houston fell slightly, down 2.0%. In comparison, Tacoma was the only port to post growth, up 4.7% sequentially. September import volume data from the top 10 U.S. ports highlighted seasonal effects and also suggested that importers may remain cautious as they deal with uncertainty about tariffs.
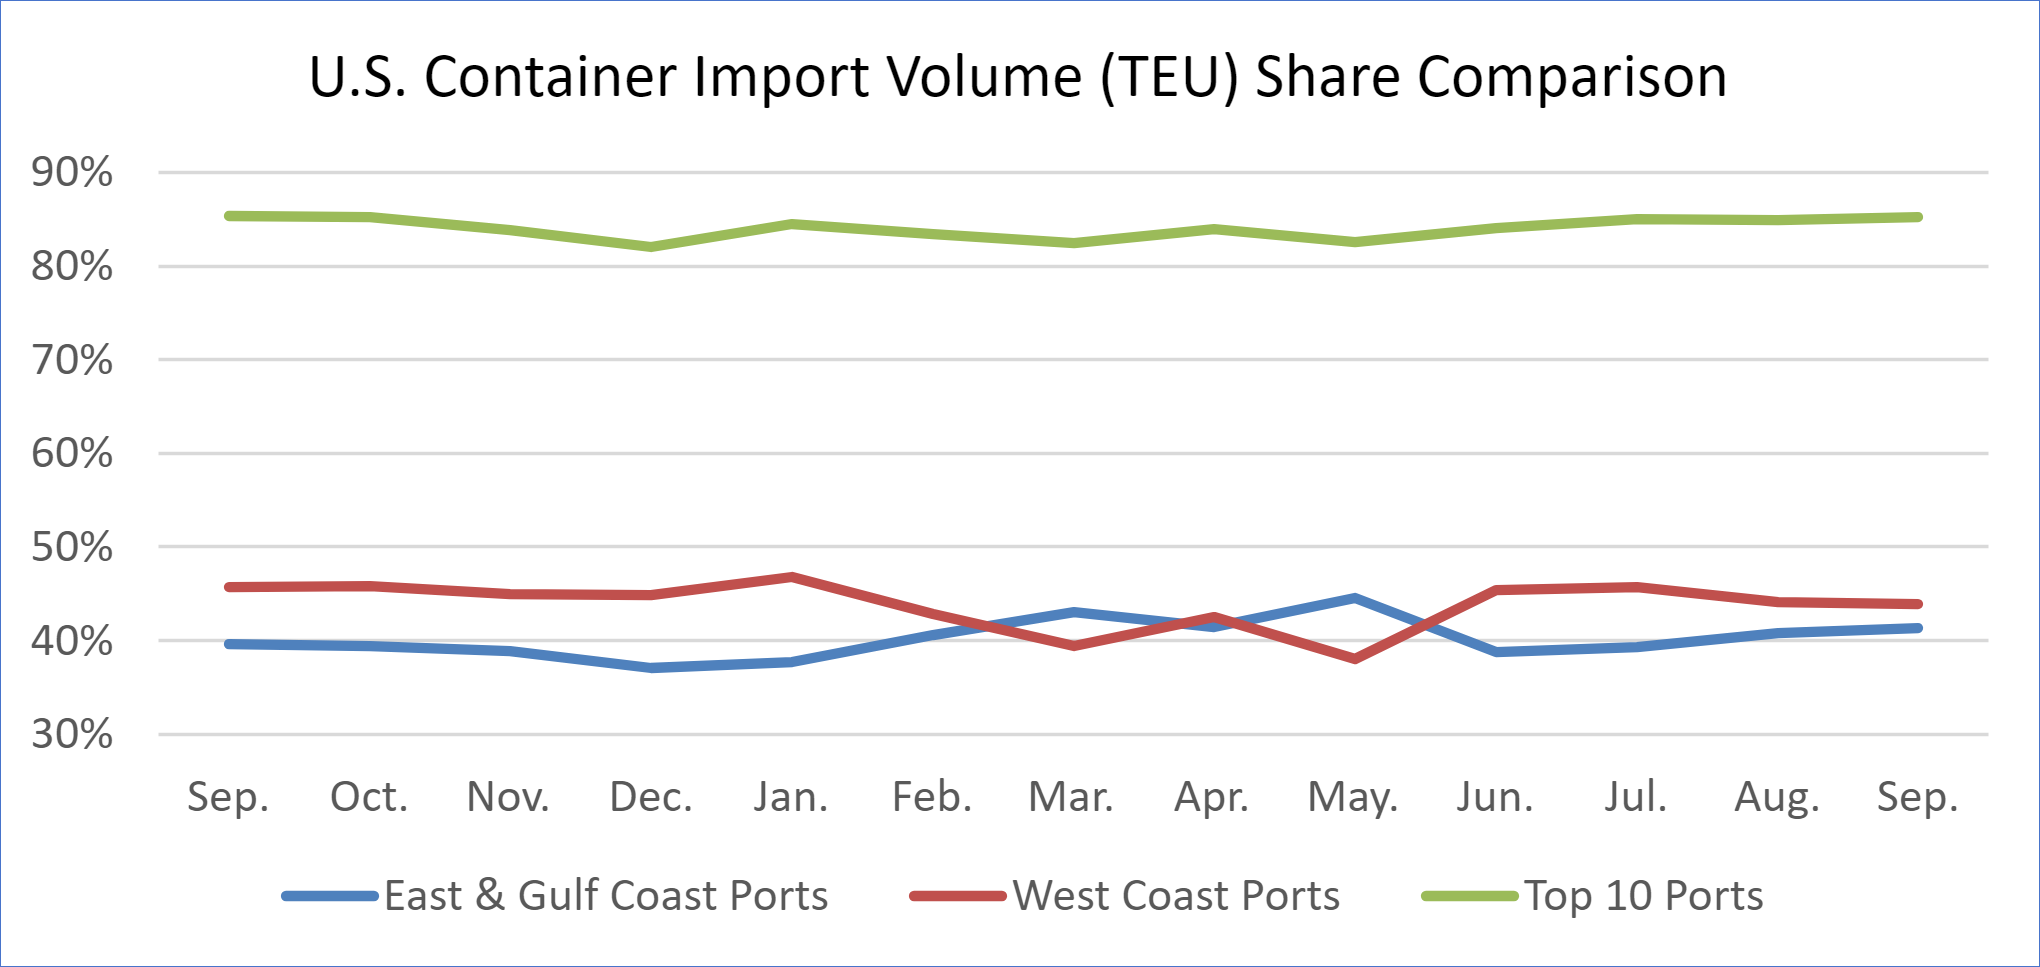
The market share of US East and US Gulf ports increased slightly, while the market share of West US ports decreased slightly.
In September 2025, the top five ports in the Western United States dropped from approximately 44.1% to 43.9% (-0.2%). The market share of the top five ports in the East US and US Gulf rebounded slightly to 41.3% (+0.5%).
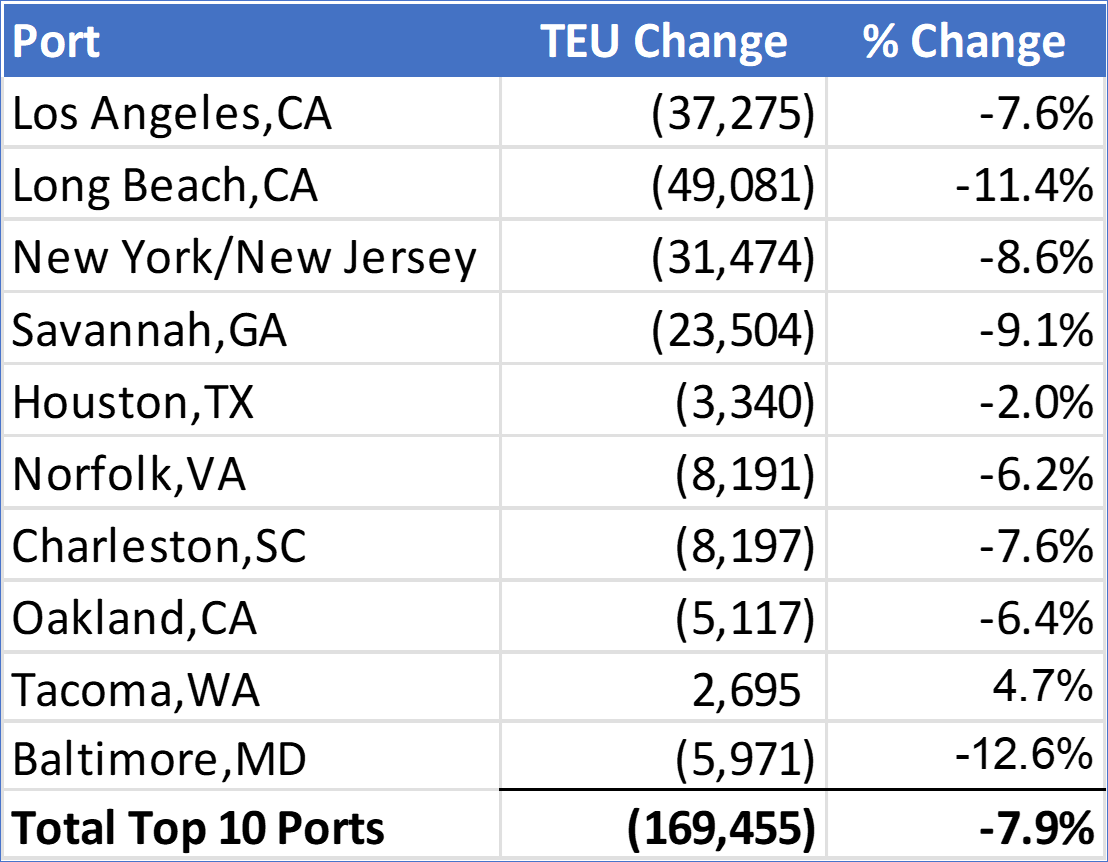
Overall, before the U.S.The container import volume of the 10 major ports accounted for 85.2% of the total volume in September, a slight increase of 0.3% from August.
Delays at major U.S. ports improved slightly in September
Overall, major U.S. ports continue to handle throughput efficiently with no obvious signs of congestion.
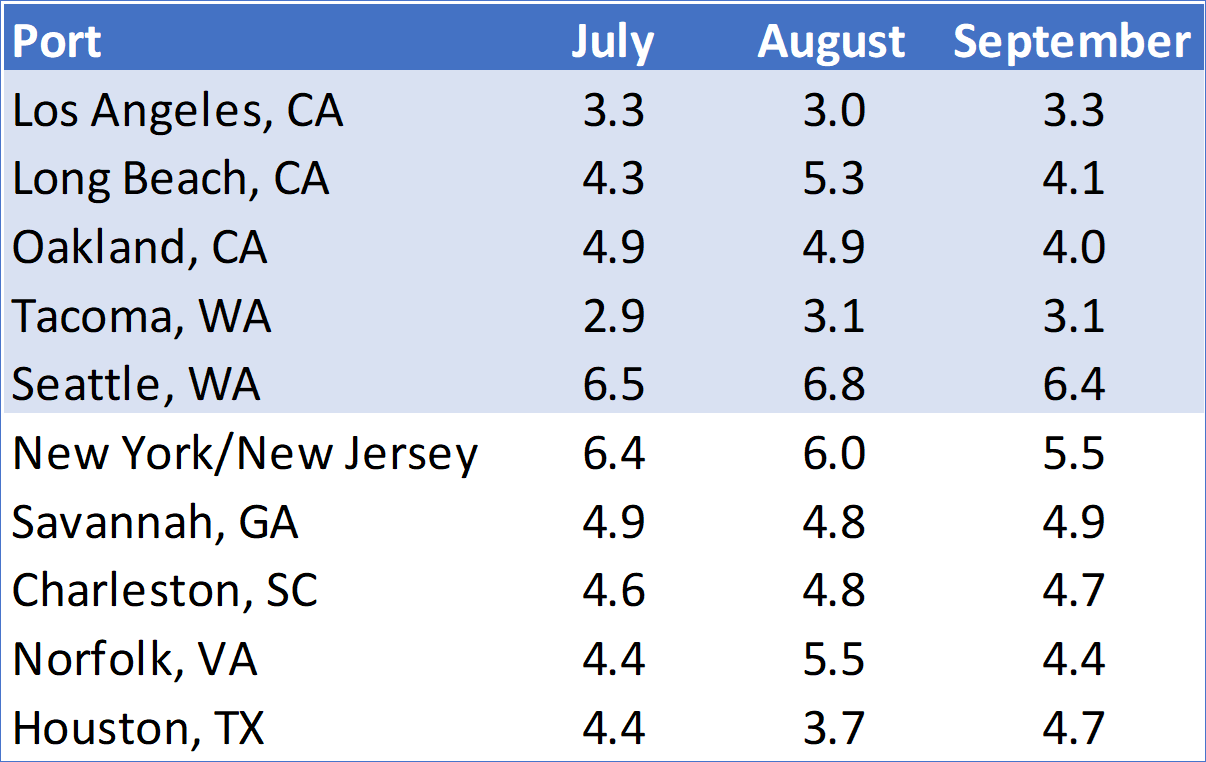
Descartes analysts pointed out that the continued "shutdown" of the U.S. federal government and weak economic indicators will continue to put pressure on the global supply chain. The U.S. government shutdown will result in the furlough of approximately 750,000 federal employees. While container import volumes at ports remain stable, prolonged disruptions could create backlogs, increase compliance uncertainty and add another layer of risk to supply chain planning.
Meanwhile, U.S. tariff policies are now facing a legal challenge in the Supreme Court, leaving importers weighing risks and prioritizing early shipments and supply chain diversification. New"301 port fees" may increase transportation costs and customs clearance risks. The impact of the Red Sea crisis on supply chains is expected to continue.
The reprinted content comes from the Internet. The purpose is to convey more information and facilitate learning and communication. If there is anything inappropriate, please contact us to delete it.
Global steel demand is expected to reach approximately 1.772 billion tons in 2026
WTO sharply lowers global goods trade growth forecast for 2026


