


From January to July 2025, a brief analysis of China's stainless steel import and export data
1. Stainless steel import and export volume
(1) Domestic stainless steel import volume
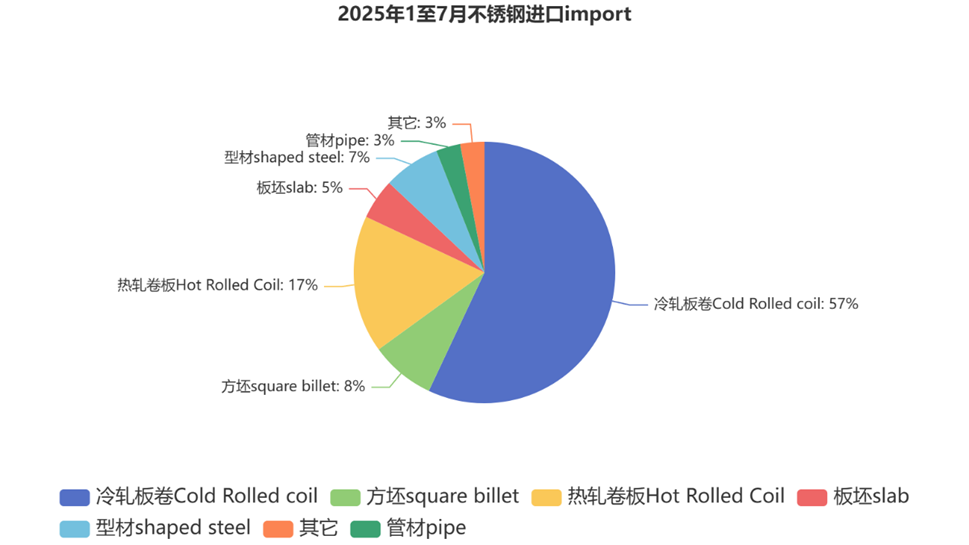
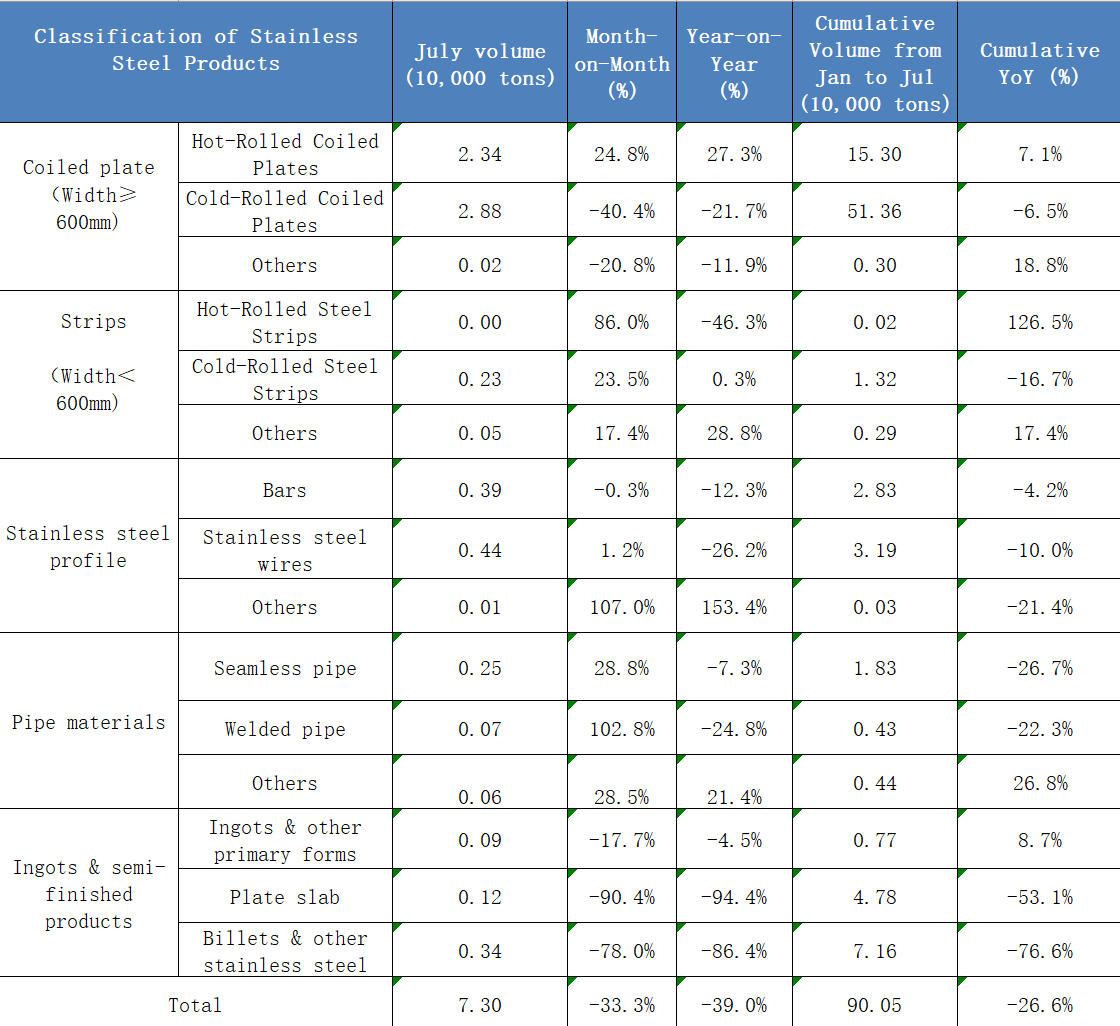
According to China's customs statistics: In July 2025, China's stainless steel imports were about 73,000 tons (the lowest in 64 months), a decrease of 36,500 tons month-on-month, a decrease of 33.3%; a decrease of 46,700 tons year-on-year, a decrease of 39%.
From January to July 2025, China's stainless steel imports totaled about 900,500 tons, a year-on-year decrease of 327,000 tons, a decrease of 26.6%.
The decline in imports was mainly caused by the decrease in cold-rolled coils and billets imported from Indonesia, with a decrease of 21,200 tons and 22,400 tons respectively month-on-month.
(2) Domestic stainless steel export volume
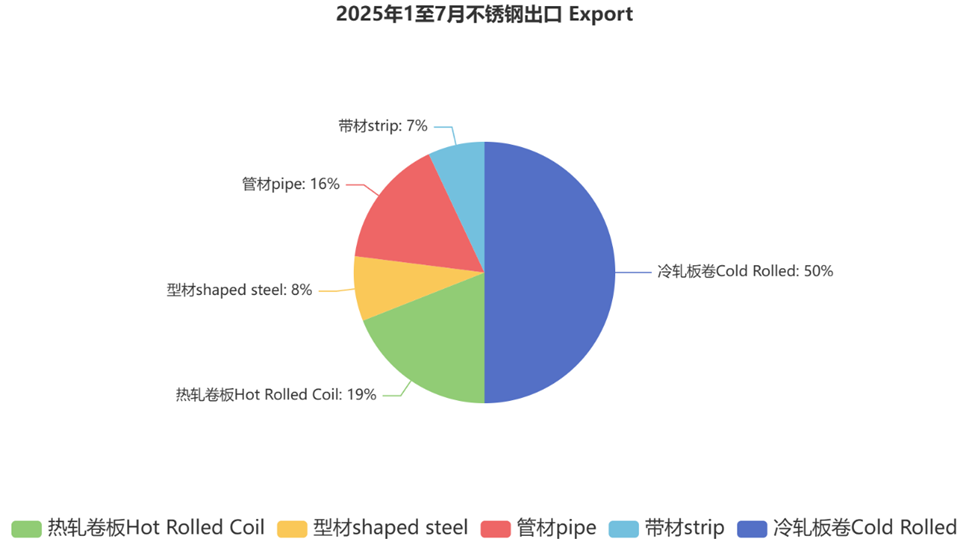
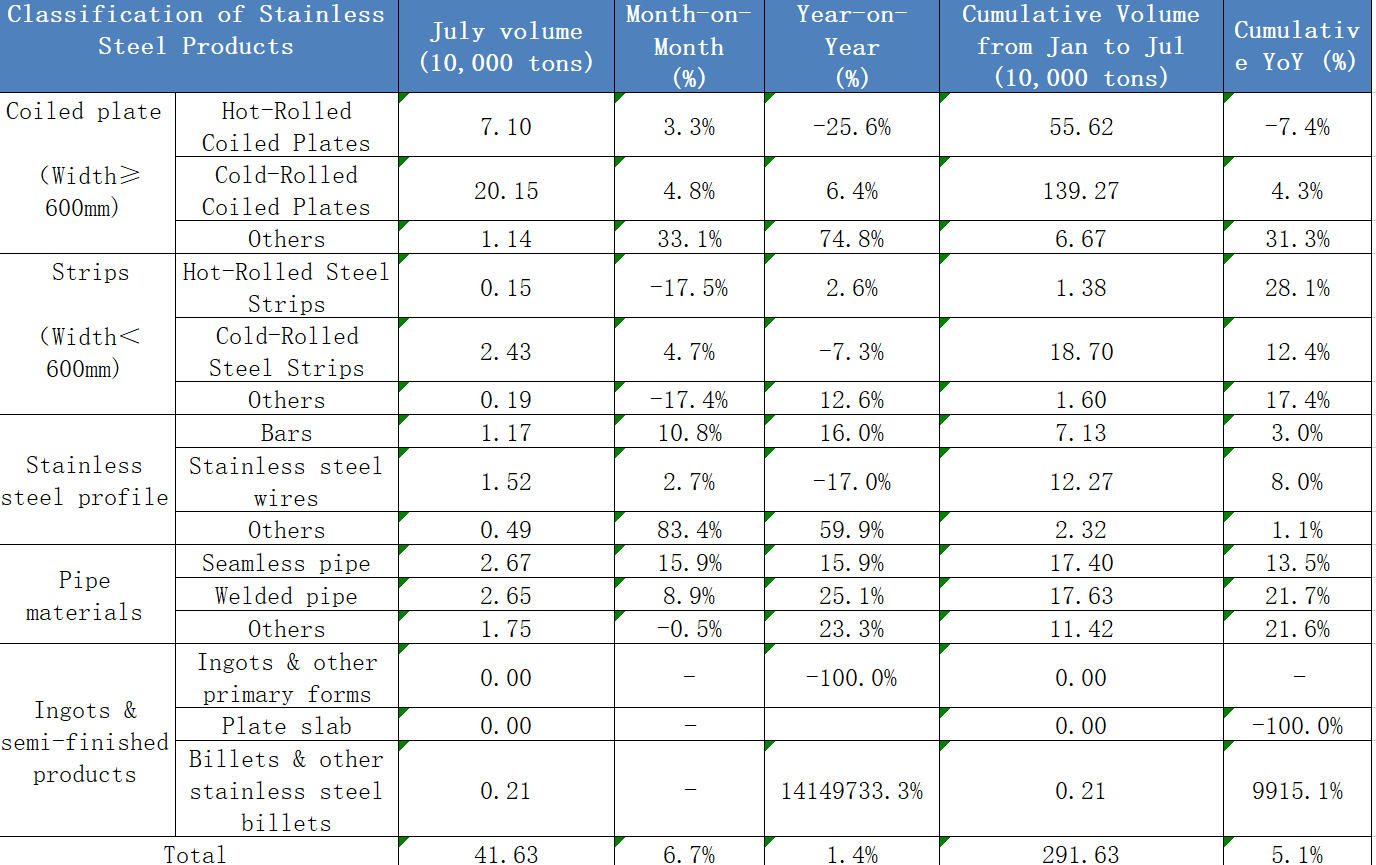
According to China's customs statistics: In July 2025, China's stainless steel exports were about 416,300 tons, an increase of 26,300 tons month-on-month, an increase of 6.7%; an increase of 5,700 tons year-on-year, an increase of 1.4%.
From January to July 2025, China's stainless steel exports totaled about 2.9163 million tons, an increase of 141,000 tons year-on-year, an increase of 5.1%.
In July, domestic stainless steel exports increased slightly month-on-month, mainly due to the small increase in rolled plates and pipes, with an increase of 14,300 tons and 5,700 tons respectively on the previous month.
(3) Net export volume of domestic stainless steel
According to China Customs statistics: In July 2025, China's net stainless steel exports were about 343,200 tons (the highest this year), an increase of 62,800 tons month-on-month, an increase of 22.4%; an increase of 52,400 tons year-on-year, an increase of 18%.
From January to July 2025, the net export volume of stainless steel was about 2.0159 million tons, an increase of 468,000 tons year-on-year, an increase of 30.2%.
2. Top five import areas
The domestic stainless steel import areas are relatively concentrated, mainly Indonesia, Japan and South Korea. In July 2025, the import volume from the three places was 60,000 tons, accounting for 81.9% of the total domestic import volume. The cumulative import volume of the three places is about 810,000 tons, accounting for 89.9% of the total domestic import volume.
In July, the volume in the top five imports was about 64,000 tons, accounting for 87.5% of the total domestic imports. The cumulative import volume of the five regions is about 837,000 tons, accounting for 92.9% of the total domestic import volume.
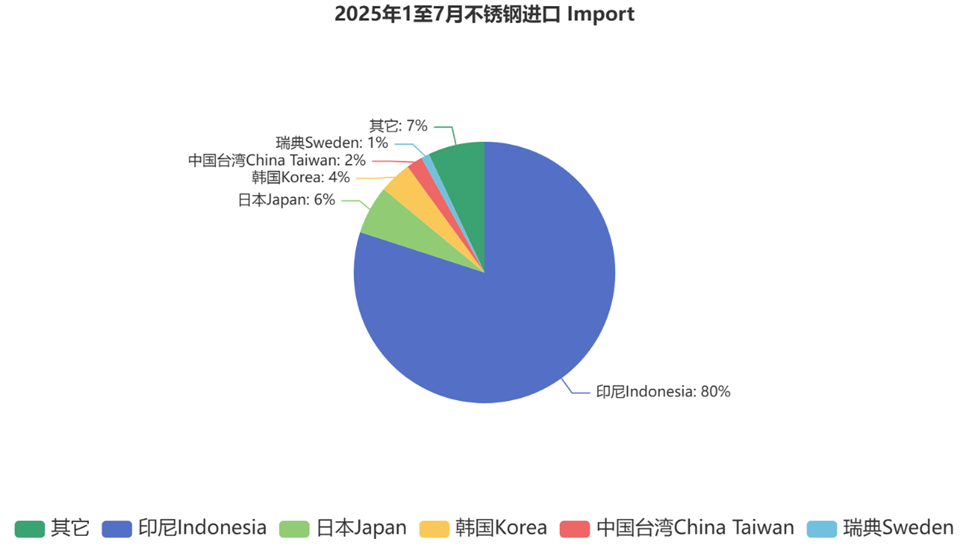
In July, the volume of stainless steel imported from Indonesia fell by 46.1% month-on-month and 51.8% year-on-year
According to statistics from China's customs: In July 2025, China's total stainless steel imports from Indonesia were about 46,200 tons, a decrease of 39,500 tons month-on-month, a decrease of 46.1%; a decrease of 49,700 tons year-on-year, a decrease of 51.8%.
Among them, the hot rolling volume was about 17,400 tons, an increase of 4,000 tons month-on-month, an increase of 29.8%; an increase of 1,200 tons year-on-year, an increase of 7.2%.
The cold rolling volume was about 24,500 tons (the lowest level in 11 months), a decrease of 21,200 tons month-on-month, a decrease of 46.3%; a decrease of 8,800 tons year-on-year, a decrease of 26.4%.
The volume of slabs was about 1,000 tons (the lowest in 27 months), a decrease of 11,100 tons month-on-month, a decrease of 91.5%; a decrease of 19,800 tons year-on-year, a decrease of 95.1%.
The volume of square billets and other steel billets was about 28,000 tons (the lowest in 27 months), a decrease of 11,200 tons month-on-month, a decrease of 80%; a decrease of 22,000 tons year-on-year, a decrease of 88.7%.
From January to July 2025, China's cumulative amount of stainless steel imported from Indonesia was about 722,700 tons, a year-on-year decrease of 329,100 tons, a decrease of 31.3%. Among them, the cumulative hot rolling was about 116,100 tons, a year-on-year decrease of 5,400 tons, a decrease of 4.4%; the cumulative cold rolling was about 491,600 tons, a year-on-year decrease of 34,500 tons, a year-on-year decrease of 6.6%; the cumulative slabs were about 47,200 tons, a year-on-year decrease of 53,900 tons, a year-on-year decrease of 53.3%; the cumulative volume of billets and other steel billets was about 63,700 tons, a year-on-year decrease of 235,800 tons, a year-on-year decrease of 78.7%.
3. Main export areas
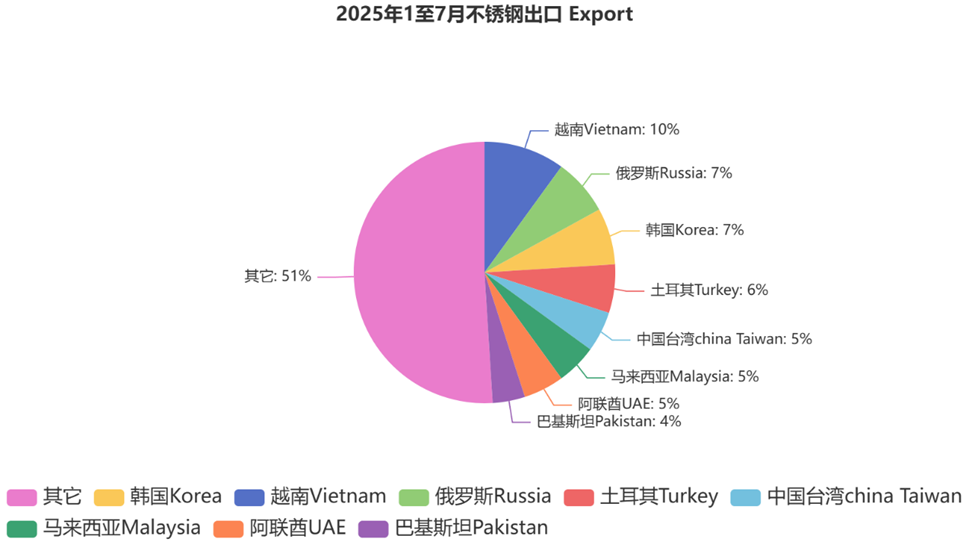
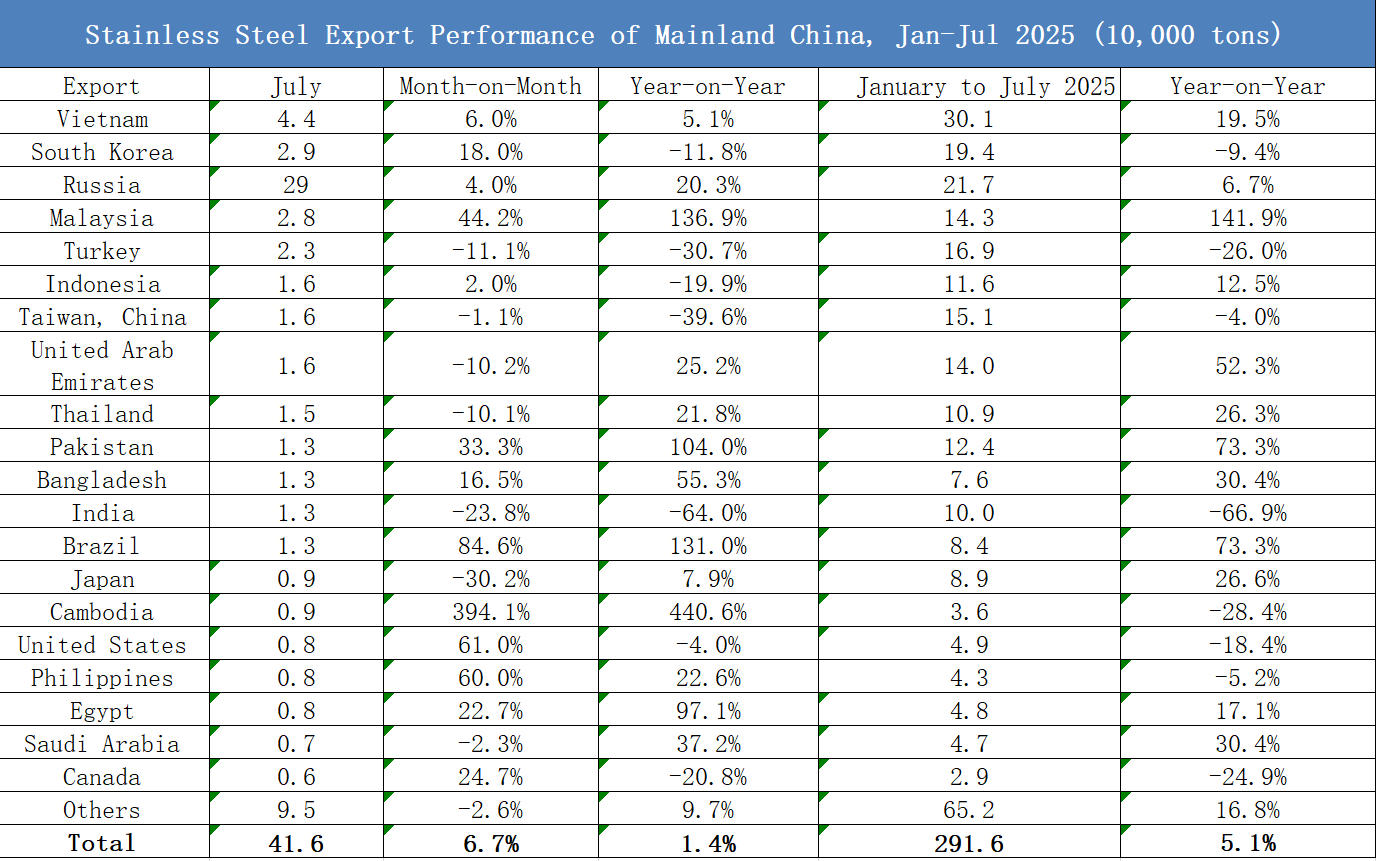
In July 2025, the export volume of the top ten regions in mainland China was about 228,000 tons, accounting for about 54.76%. From January to July 2025, the cumulative amount was about 1.664 million tons, accounting for about 57.1%.
In July 2025, the export volume of the top 20 regions in mainland China was about 321,000 tons, accounting for about 77.1%. From January to July 2025, the cumulative amount was about 2.265 million tons, accounting for about 77.66%.
4. Export situation
On May 12, the Ministry of Commerce of China issued a joint statement on economic and trade talks between China and the United States, and the United States will reduce the imposition of tariffs on Chinese goods from 145% to 30% for 90 days.
At the end of July, China and the United States decided to extend the 90-day tariff suspension period in the economic and trade negotiations between Stockholm, Sweden.
China's exports of stainless steel increased in July, with most varieties increasing slightly. Mainly because export pressure eased during the US tariff exemption period, some orders were centralized to deal with potential tariff policies, and export orders increased. At the same time, in order to avoid the possible 232 tariffs imposed by the United States, involving Southeast Asian re-export products, domestic manufacturers and exporters exported to Southeast Asia increased.
In July 2025, the domestic export volume of Southeast Asia was about 126,000 tons, an increase of 16,300 tons month-on-month (accounting for 62.1% of the export increase), an increase of 14.8%; an increase of 19,800 tons year-on-year, an increase of 18.5%.
From January to July, the cumulative volume was about 817,800 tons, an increase of 180,700 tons year-on-year (the total domestic stainless steel exports increased by only 141,000 tons), an increase of 28.4%.
On August 1, according to the US executive order, import tariffs ranging from 10% to 41% will be imposed on 69 economies, including the EU, Japan and Southeast Asian countries. The new tariffs will be implemented from 0:00 on August 7, and some countries will apply the extension to October due to negotiations. This executive order of the United States clearly states the "40% re-export punitive tariff" into the terms, which will directly affect China's export model through Southeast Asian countries.
On Tuesday (August 19), the U.S. Department of Commerce announced that it would include 407 product categories on the steel and aluminum tariff list, with an applicable tax rate of 50%. According to the content of the list, stainless steel materials do not involve stainless steel dining tables, kitchens or other household appliances and their parts, stainless steel washing tanks and washbasins, stainless steel machines, and other downstream products such as stainless steel woven fabrics.
The global trade environment remains complex, and subsequent export pressures for stainless steel remain.
This article is from the Internet and the copyright belongs to the original author. The website publishes this picture and text for the purpose of conveying more information. It is designed to collect and provide it to meet the information needs of the majority of users. It is not advertising service information. If there is any infringement, please contact us to delete it.
Analysis of China's stainless steel import and export data from January to September 2025
China import and export of stainless steel pipes from January to June 2025
Related Article


